FACE FORM FINDER · 4 OCTOBER 2026
Facial Width to Height Ratio
The top line, as the first page places it
The results for this term open with a summary box and then run a calculator, an encyclopedia entry, a summary of the evidence, a commercial article, a second calculator, a methods page, a forum thread, a short article and a video. The cheekbone span is the same story in all of them. The line at the top of the height is not, and most of them never place it at all.
| Where it is named | The line that entry names |
|---|---|
| The summary box above the results | the lowest point of the eyebrow, or the middle of it |
| QOVES | the lowest point of the brow |
| Perfect Corp | the highest point of the eyelid, or the middle of the brow |
| The encyclopedia entry | the top of the eyelid, about the level of the nasion |
| The Face Report | the middle of the upper eyelid |
Read the first and third rows again. Both are definitions that do not define: each hands you two lines and leaves the choice to you. The other three do choose, and no two of them choose the same place. Between the lowest point of the brow and the middle of the upper eyelid there is 14 mm on the reference face further down this page — and that is before anyone takes a photo. Two entries, Ties de Kok and the methods page, name neither endpoint, so there is nothing to line up at all.
The first page also disagrees with itself
Two entries go further than disagreeing with each other. The Face Report puts the middle of the brow on the method the fraction was originally built on. QOVES puts the lowest point of the brow on that same method. One method, two heights, and both descriptions sit on the same first page, a few entries apart.
QOVES also carries a contradiction inside itself. Its text says the fraction was built to leave the chin and the jaw out of it, because those finish growing later than the upper face. Its own figure, on the same page, reports that widening the lower face raised the reading from 1.47 to 1.49 on one face, under the same lighting and the same framing. A fraction that leaves the lower face out cannot be moved by widening the lower face. The page never reconciles the two, and the distance between them is the whole question of what the number is measuring.
One face, four lines
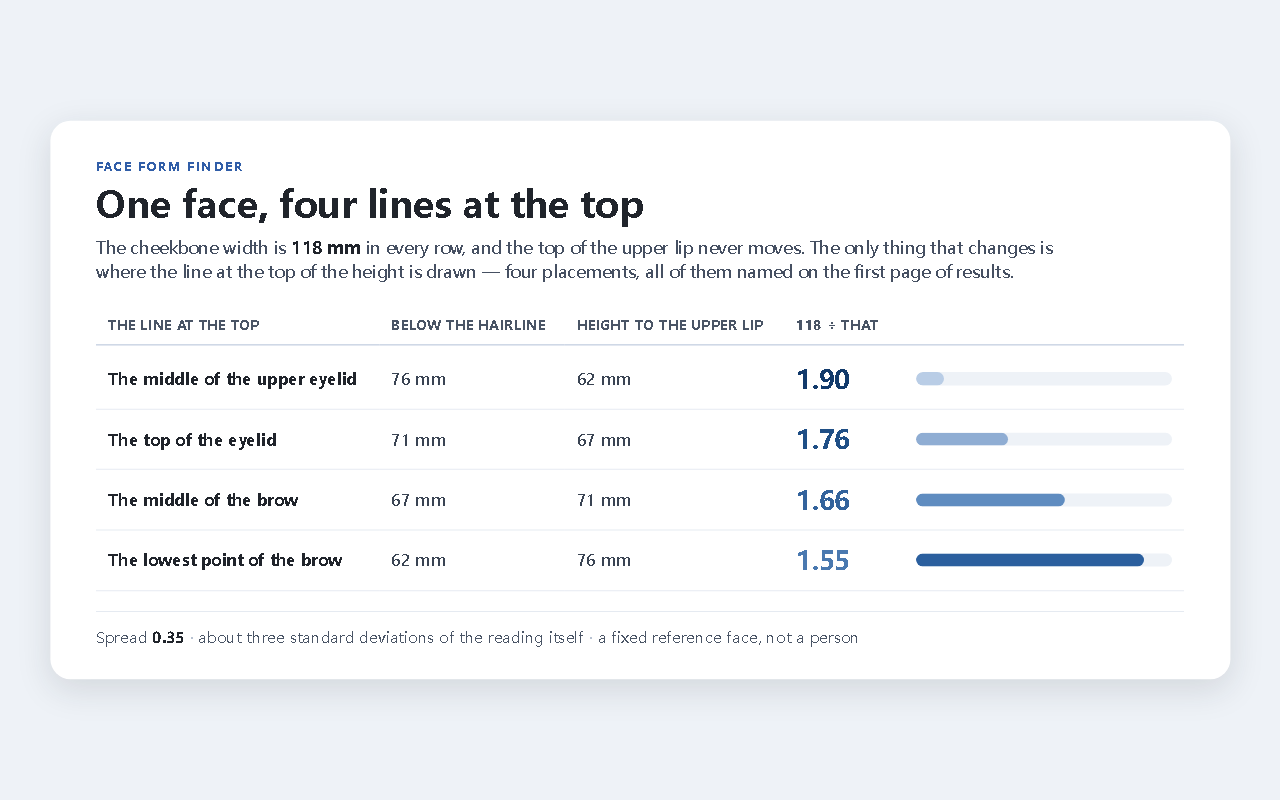
To see what the choice costs, the face has to stop moving. The distances below are a fixed reference set in millimetres, assembled so the arithmetic can be checked rather than trusted. It is a defined reference, not a person, and a real face will not land on these numbers.
| Distance | mm |
|---|---|
| Hairline midpoint to brow ridge | 62 |
| Brow ridge to base of the nose | 61 |
| Base of the nose to top of the upper lip | 15 |
| Brow ridge to top of the upper lip | 76 |
| Brow ridge to the middle of the brow | 5 |
| Brow ridge to the top of the eyelid | 9 |
| Brow ridge to the middle of the upper eyelid | 14 |
| Cheekbone to cheekbone | 118 |
Every reading below is now one division between two rows of that table. The width never changes, the top of the upper lip never changes, and nothing else about the face changes from one row to the next.
| The line at the top | Height to the top of the upper lip | 118 ÷ that |
|---|---|---|
| The middle of the upper eyelid | 62 mm | 1.90 |
| The top of the eyelid | 67 mm | 1.76 |
| The middle of the brow | 71 mm | 1.66 |
| The lowest point of the brow | 76 mm | 1.55 |
What a 0.35 spread is worth
In the samples that print a spread of their own readings, one standard deviation is about 0.11. Choosing the line therefore moves the number about three standard deviations, which is a large move for a decision that is usually left unstated. Set that against what the entries on this first page spend the most words arguing about. The difference between men and women on this fraction is reported at about 0.11 standard deviations — a fraction of one. The line you pick is not a detail that can be left to the page. On this reference face it is more than three times the size of the effect everyone is arguing about.
The bands move with the line
The bands on the first page do not line up either, and they cannot, because each band is a band for one particular line.
| Entry | Band |
|---|---|
| QOVES | adult men 1.7–2.1, adult women 1.7–2.0 |
| Perfect Corp | men 1.8–2.0, women 1.6–1.8 |
| The Face Report | 1.8–2.1, for its own eyelid line only; its own sample’s middle reading was 2.02 |
| The summary box above the results | 1.6–1.7 reads narrow, 1.8–2.0 reads average, 2.1 and up reads wide |
Now put the fixed face back in. On the line from the middle of the upper eyelid it reads 1.90, inside every band in that table. On the line from the lowest point of the brow it reads 1.55, below every band in that table. One face, one photo, and whether it counts as average or narrow is decided by which line the entry you happen to be reading used. That is why the same face can come back as a different verdict from two calculators on the same afternoon.
When to stop
- Stop when an entry names the width and not the line. Half a fraction is not a fraction. A cheekbone span on its own is a distance, and there is nothing to hold it against.
- Stop when the definition contains the word “or”. An or is two readings wearing one name. Pick one, write down which, and treat any other reading of the same face as a different number.
- Stop comparing two readings unless both name the same line. On the reference face the line alone is worth 0.35, which is most of the distance between a narrow reading and a wide one.
- Stop when the number is used to argue about a difference smaller than the line’s own effect. Three standard deviations of movement from a choice, set against a fraction of one in the thing being argued about, is not a statement about the face.
- Stop when the photo was taken close to the lens. A short camera distance stretches the middle of the face and squeezes the sides, so the fraction moves with the lens while the head stays exactly as it was.
The fixed reference face, the four named lines, the height each produces, the four ratios and the bands, as a CSV.
The four lines on one card
Questions
What is a good facial width to height ratio?
There is no single answer, because the band depends on the line. On the fixed face above, the same head reads 1.90 on one line and 1.55 on another, and 1.90 sits inside every band on the first page while 1.55 sits below all of them. A sharper question is: a good value on which line? If the entry does not name the line, the band it quotes is not something you can hold your own reading against.
Is a higher facial width to height ratio better?
The entries on the first page do not agree that it is good at all, and a higher reading has a second problem: it can come from a lower line rather than a wider face. Move the top line down 14 mm on the fixed face and the reading rises 0.35 with the width untouched. Before you read anything into a higher number, find out which line produced it.
Does facial width to height ratio ignore the jaw?
That was the reason it was built, and one entry on the first page says so outright. The same entry then reports its own figure moving when the lower face was widened. If the fraction really left the jaw out, widening the jaw could not have moved it. Treat the jaw-independence as a design intention that has not been demonstrated on the page that states it.
Why do two calculators give me different numbers for the same face?
Usually one of three reasons. They may be using different lines at the top, which is worth up to 0.35 on the reference face. They may be using different photo setups, since a close camera distance changes the fraction on its own. Or one of them may be dividing the other way round. Ask each one for the two endpoints and the units; if it cannot give all three, its number does not travel to the other.
Related guides
- Midface Ratio — the same problem one level down: there the top of the fraction is agreed and the bottom is not.
- Facial Ratios — what happens to a reading when the same face is measured to two different endpoints.
- Face Shape Chart — the thirds of the face, and how to check them at home with a soft tape.
- Eye Shape Chart — the eye width and the pupil distance, in millimetres.
- Jawline Shape — the three jaw readings, and how far the sample spread runs.
- Face Symmetry Test — the other proportion reading, and where it stops.