FACE FORM FINDER · 30 SEPTEMBER 2026
Facial Ratios
A "face with golden ratio" is a face whose length divided by its width lands near 1.618. The problem is not the number. It is that "face length" has no agreed start or end point, and that choice moves the result more than the face does.
We put one fixed face through a golden-ratio calculator twice and changed nothing but where face length begins. From the hairline: length ÷ width 1.568, that ratio scored 92, overall 71 — "Above Average". The same face measured from below the hairline: 1.042, that ratio scored 11, overall 55 — "Distinctive". One face, one tool, one endpoint moved — a sixteen-point swing in the headline number.
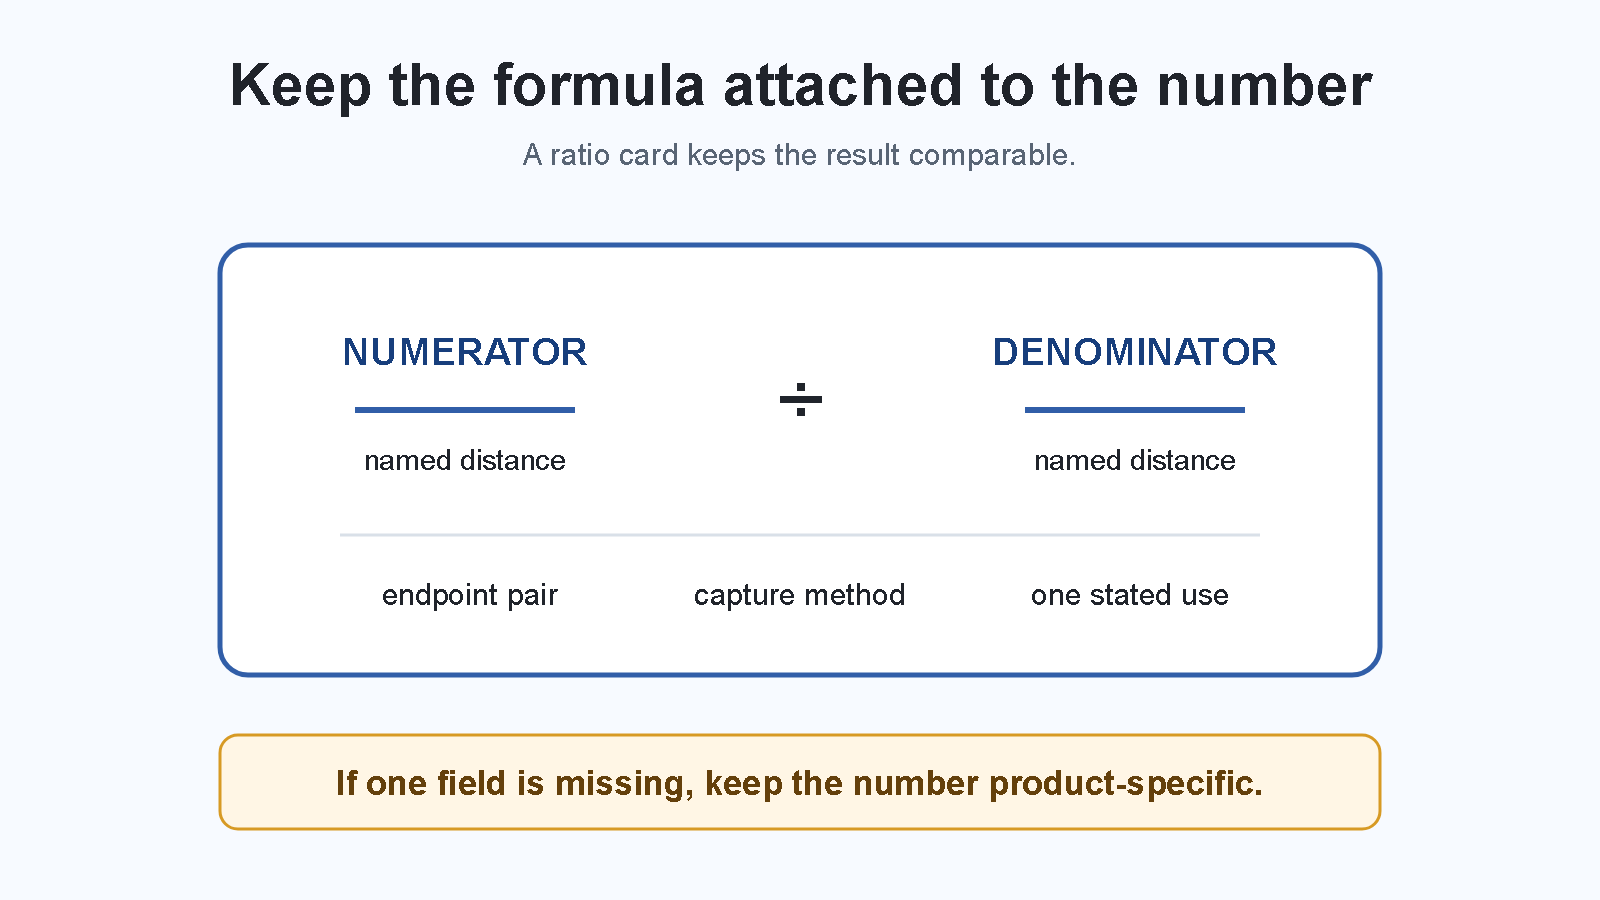
The rule comes second, not first. A facial ratio is useful only when the formula stays attached to the result. Before you compare a number, write its numerator, denominator, endpoint pair, capture method, and the question it is meant to answer. If any of those are missing, keep the number as that product’s own output and stop there.
What the same face returns from the golden-ratio calculators on the first page
We gave one face to the calculators that come up on the first page of results for this term. The face is a fixed set of measurements in millimetres, built for comparison — not a real person. Every field below came back from the calculator itself.
Only one of the three accepts numbers by hand. The other two take a photo upload. That is the first thing worth knowing: on two of them you cannot choose your own endpoints at all.
| Ratio | Run A: length from the hairline (185 mm) | Run B: length below the hairline (123 mm) |
|---|---|---|
| Face length ÷ face width | 1.568 — score 92 | 1.042 — score 11 |
| Mouth ÷ nose width | 1.371 — score 62 | 1.371 — score 62 |
| Lower face ÷ nose length | 1.240 — score 42 | 1.240 — score 42 |
| Inter-eye gap ÷ eye width | 1.100 — score 75 | not returned |
| Nose width ÷ inter-eye gap | 1.061 — score 85 | not returned |
| Overall score | 71 — "Above Average" | 55 — "Distinctive" |
Every other ratio in that table is identical between the two runs, because they do not use face length. That is the useful part: the damage was contained to the one ratio whose endpoint moved, and it was still enough to move the headline number by sixteen points.
What each tool says it is measuring
| Tool | Face length, as the tool defines it | Target | Reference base it cites |
|---|---|---|---|
| OblongFaceShape.com | "soft tape from the centre of your hairline straight down to the chin tip" | phi for three ratios, 1.0 for two | 51,247+ analyses; Farkas (1994) landmarks |
| The Face Report | "face landmarks cannot see the hairline, so the top band starts at the top of the visible forehead" | phi 1.618 — and the same page states it "reads ≈1.38" inside its own measurement window | 10,381 faces; 478 landmarks |
| Golden Ratio Face | forehead to nose bridge, compared with nose bridge to chin | phi, averaged into one Harmony Score | not stated |
One of these three starts face length at the hairline. One states outright that it cannot see the hairline. One measures forehead to nose bridge and calls that the upper face. They are not measuring the same length, and all three publish a number near 1.618 as if they were.
Two numbers the tools publish about themselves
- The Face Report states its facial-thirds ideal as three equal bands of about 33% each, then reports that the median face it measures reads 16% / 44% / 40%. The canon and the measurement disagree, and the page says so.
- The same tool states that the phi ideal of 1.618 "reads ≈1.38 over the visible forehead-to-chin window" its landmarks measure. The ideal and the reachable number are different, and only that page prints both.
On our fixed face, the ratios ranged from a score of 92 down to 42 while the overall result sat at 71. The headline number is an average across ratios that do not agree with each other. Read the ratio you care about, not the average.
Download the full comparison table as CSV — every input, every value returned, each tool's stated endpoint definition, dated 30 September 2026.
What people post when they measure themselves
People who measure themselves at home post their own numbers and ask which shape they are. The numbers often contradict themselves before any tool sees them:
| Measurements as posted | What does not add up |
|---|---|
| "Forehead: 12, Cheekbones: 18, Jawline: 11 x 2 (22), Full length: 17" (cm) | Full length 17 cm is shorter than the 18 cm cheekbone width — a face cannot be shorter than it is wide |
| "Length 7 cm, Forehead 6 cm, Cheek 5.5, Jawline 8 cm" | Length 7 cm against a jawline of 8 cm — the same contradiction again |
| "Length: 8.7 inches, Forehead till eyebrows: 3.5 inches" | Uses "forehead till eyebrows" where everyone else writes "forehead" — a different endpoint under the same word |
| "Forehead: 6 inches, Cheekbones: 9 inches, Jawline: 4*2=8, length: 8 inches" | One side measured and doubled by hand; the result equals the jawline exactly |
None of these people made a mistake in arithmetic. They each measured something, used a word another person uses for a different landmark, and mixed inches with centimetres. A calculator will score all four without complaint.
Where 1.618 came from
The number has a longer paper trail than the tools suggest. The sequence appears in the work of the Indian poet and mathematician Pingala, centuries before Fibonacci wrote it into chapter 12 of Liber Abaci in 1202. In the 1860s Gustav Fechner ran the rectangle experiments — asking people to pick the rectangle they liked best — that put the ratio into psychology rather than geometry. Sunflowers carry it in a way you can count: the seeds form spirals in both directions, and the two counts land on adjacent numbers in the sequence.
What the sequence does not do is stay still. The ratio between consecutive Fibonacci numbers changes every step and settles on 1.618 only in the limit — a point one reader put more sharply than any tool does: "Fibonacci numbers ≠ golden ratio. Golden ratio is a fixed 1.618. The ratio between Fibonacci numbers changes every time and never repeats."
The 45-second version
If the player does not load, watch it on YouTube: Facial Ratios: Keep the Formula Attached to the Number.
Make a ratio card, not a score list
| Card field | What to write | Why it stays with the number |
|---|---|---|
| Numerator | The first stated distance. | A ratio can move because this distance moved. |
| Denominator | The second stated distance. | Changing it creates a different comparison. |
| Endpoints | The two landmarks for each distance. | A name alone does not reveal where the line begins and ends. |
| Capture | Photo or tape, camera position, crop, and visible landmarks. | The same label can be calculated from a different view. |
| Use | The narrow question the ratio addresses. | An aggregate score cannot explain a single ratio for you. |
Keep angles and ratios on different cards
An angle describes the direction between lines. A ratio divides one distance by another. They may appear in the same report, but they are not interchangeable readings. Keep each attached to its own landmarks and capture conditions before deciding whether either result is repeatable.
Read a change without inventing a cause
If a ratio changes, first look at the two raw distances. The number alone cannot tell you which endpoint moved, which distance changed, or whether the capture changed the visible landmarks. Recreate the same card before you infer a difference in the face.
Same formula and matched capture: repeat the reading and compare it. Different endpoints or capture: keep the two cards separate. Missing endpoint or method: record "not comparable" instead of borrowing a nearby ratio or reference range.
Use "not measured" as a boundary
A missing endpoint tells you what the capture cannot support. Choose the next photo or focused tool to reveal that endpoint; do not chase a preferred number by substituting another measure. A reference range without a stated formula does not repair the gap.
Questions
Can I compare facial ratios from two tools?
Only compare two facial-ratio results when both report the same numerator, denominator, and endpoint pairs measured the same way. A tool that calls both outputs "the ratio" can still be dividing different distances, so a shared label is not enough. Before calling them a disagreement, write each result’s ratio card: the exact points used, the units, and the capture conditions. If those do not match, keep each number inside the tool that produced it.
Why did my facial ratio change between photos?
A changed ratio between two photos usually means a changed measurement, not a changed face. Check the raw distances and the capture card first: a different crop, camera angle, head tilt, or visible endpoint can move the result without your features moving at all. Only read it as a real change after the two cards match on method. If they do not, the two numbers are different measurements, not a before-and-after.
For an outline-based reading instead of a proportion score, return to the face shape detector and fit guide.